How to run a stats report
Example: Sydney Exports
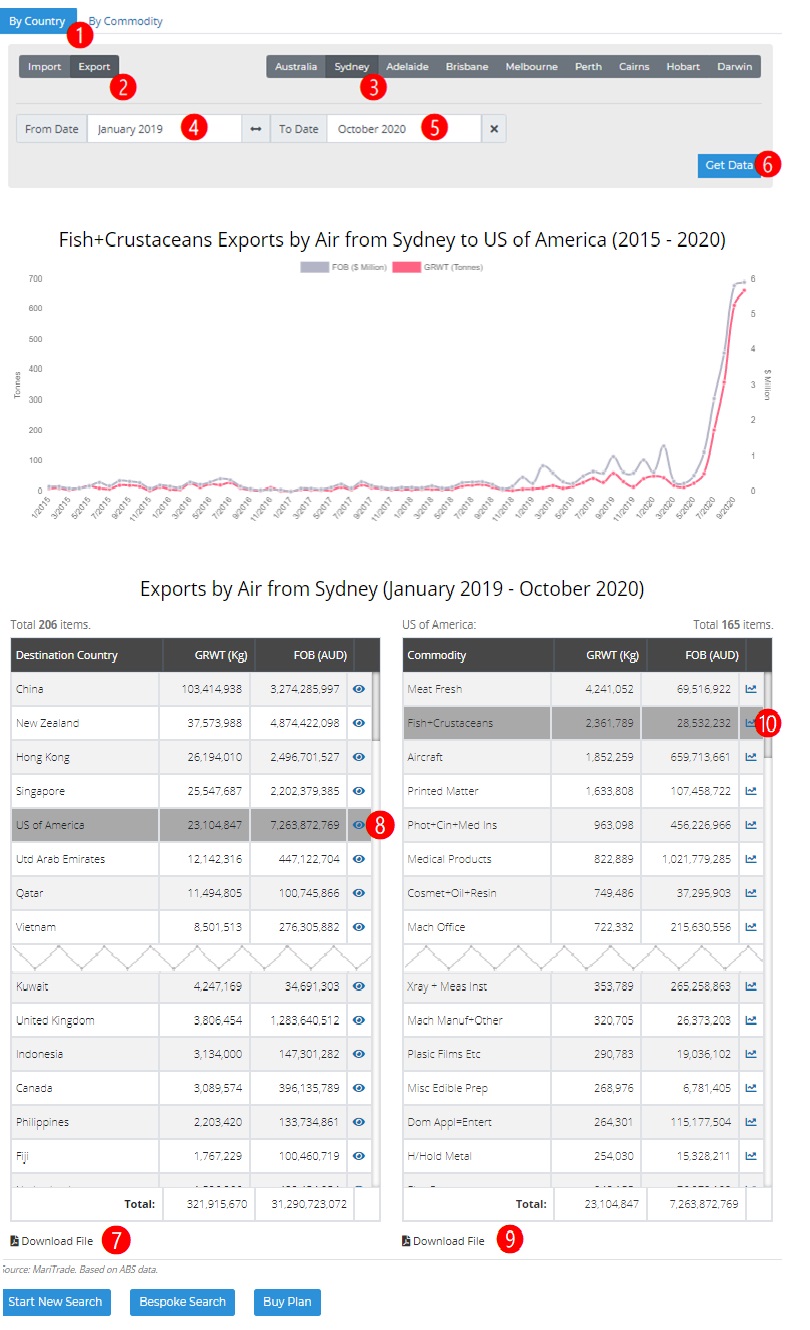
- Click ➊➋➌➍➎➏to set up query and get data for airport exports Jan19 – Oct 20 as shown
- ➊ Choose your initial sort: by commodity or by country
➋ select exports or imports
➌ select your airport
➍ select start date
➎ select end date
➏ run report - Click ➐ to download a PDF report table of results showing exports by air from Sydney for Jan19-Oct20 and the chart plotting the latest 5 years of data by month (Optional).
- Click ➑ to view US data time series chart and commodity listing table. You can click any country and the time series chart and commodity listing table will change each time.
- Click ➒ to download PDF file of Sydney to US exports commodity data table and total Sydney to US time series chart (Optional).
- Click ➓ to view chart commodity time series for Sydney Fish & Crustacean exports to US. The chart changes each time you select a different commodity in the table.
